Minimize Risk with DevOpSmartBoard Project Health Report
DevOps practices decreases the risk in deploying software changes to production environments.
Post deployment to production, there is a risk that the change will break and lead to expensive issues. This risk is minimized through continuous testing of the software in a separate test environment where the change can be safely vetted without affecting normal business operations.
In this blog post, I will explain how the DevOpSmartBoard reports increase the effectiveness of applications in production and their performance.
We are tracking the 5 key metrics and by analysing the report we can understand how effectively the teams are developing, delivering, and maintaining the software.
1. Deployment frequency
The success factors of DevOps are usually based on how long the software takes to deploy and how often the deployment takes place. The goal of deployment is to be able to release smaller deployments of code as quickly as possible. Smaller deployments are easier to test and release. They also improve the discoverability of bugs in the code allowing for faster and timely resolution of the same. A high deployment frequency is a good sign that things are going smooth in the production cycle. The Project Health report of DevOpSmartBoard provides key indicators about the project progress, including build & release failure trends, deployment frequency etc.
2. Failed Build & Deployment
A failed production deployment is always defined after outages or errors during the actual usage. This is an important DevOps metric to track the number of failed deployments from the users’ perspective. The teams are expected to build quality applications right from the start. A zero-failure rate is always liked to success but failed deployments less than 5% can be considered as close to success. The Project Health report displays the number of failed build and deployments thereby hinting the project metrics for a particular iteration.
3. Critical Bugs
Bugs in any software application are inevitable. A few occasional and cosmetic bugs aren’t a red flag but keeping track of the bugs and being on the lookout for any unusual spikes is important for the health of your application. A significant rise is an indicator of quality. In DevOpSmartBoard, we show the number of critical bugs which are not closed for a particular iteration. This helps determining the risk of the project.
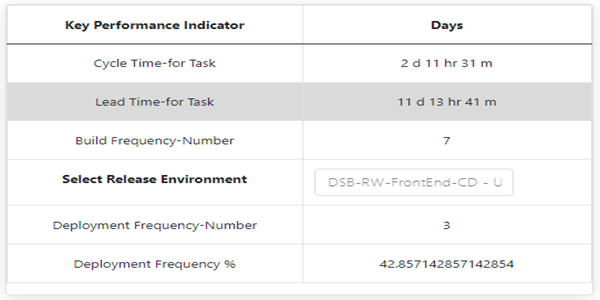
4. Lead Time
Lead time for changes in DevOps is the time taken to go from code committed to code successfully running into production. It is an important indicator to determine the efficiency in the existing process and identifying the possible areas of improvement. This is another important report in the Project Health to determine the duration.
5. Cycle Time
The amount of time from work started until work finished. This also matters very much for DevOps success, because Cycle time is the main indicator of the team’s speed to deliver value and efficiency ratio.
In this report, we've highlighted three other critical metrics: Failed Builds, Failed Releases, and Critical Bugs. These key indicators will help you evaluate the project's overall health and identify areas that may need attention or improvement. The report page will display important information, starting with data from the last 30 days. This allows you to quickly see how the project has been performing recently.
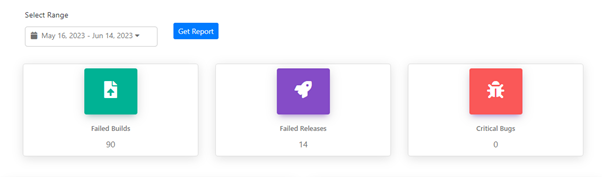
you'll find various charts that showcase important project details. These charts include Critical Bugs, Failed Builds, Failed Releases, Build Run Duration Trend, Release Run Duration Trend, and Deployment Frequency. When you hover over specific data points on these charts, you'll see additional details. For example, if you hover over the Failed Release node, it will show you the date it failed and the corresponding count. This interactive feature makes it easy to explore and understand the project's performance with just a quick look.
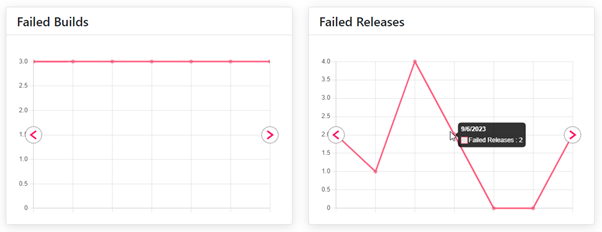
In the above section, you will find two charts that display information about failed builds and failed releases. By hovering over the charts, you can view the total count of failed builds and releases for specific dates. This feature is useful for understanding when failures occurred and the number of build and release failures. The charts provide a visual analysis, allowing you to easily track and analyse the trends of build and release failures over time for selected project.
In this section, you will explore the "Build Run Duration Trend" displayed in a chart format based on the build pipeline. Users have the option to download the chart in different formats such as CSV and XLS, and it can also be viewed as a data table.
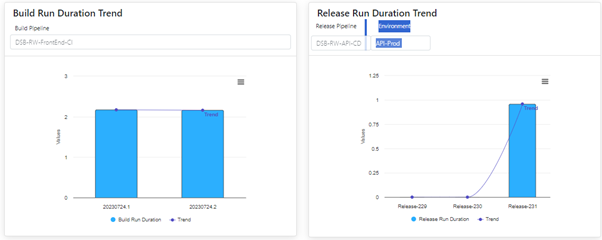
Similarly, the "Release Run Duration Trend" is based on the Release Pipeline and its environment. After selecting the desired pipeline and release, the chart will showcase the release trend. Hovering over the chart allows users to view the corresponding release ID and the duration of each release run.
This session, we will offer a comparison of both build and release duration times presented together in a single frame. This analysis will clarify and evaluating the efficiency of the deployment process.
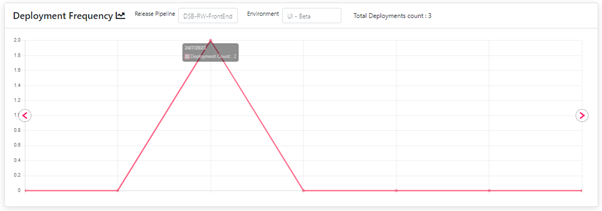
The Deployment Frequency visualization is derived from the release pipeline and release environment data. The chart showcases the total count of deployments made. calculating deployment frequency is by counting the successful pipeline runs in Azure DevOps that deploy code to the Production environment.
Canarys is a certified Microsoft DevOps partner and a verified GitHub Partner with a proven expertise for more than 30 years. We are a comprehensive solution provider, specializing in DevOps and Automation. Till date we have successfully delivered numerous projects to our clients all over the globe and won accolades. Our ever-growing list of clients show our commitment and dedication for the work. With an experienced and talented workforce, we have the confidence to beat any kind of challenge that comes our way. We take great pride in our workforce, which is of course diverse in nature and works with a positive attitude. When it’s Canarys, you can be sure of quality services and solutions.