DevOpSmartBoard
-
Project
Dashboard
DevOpSmartBoard -The Ultimate End-To-End and One Stop Dashboard solution for all the reporting needs in Azure DevOps at organization and project level. DevOpSmartBoard is currently in preview and has the following reports available:
·
DevOps Organization and project level metrics
·
Query work items with various combination of filters and
export to excel
·
User Audit: count of User licenses and types, and display
non-active users (not used Azure DevOps from last 30 days)
·
Traceability from Epic to granular level Tasks
·
User Capacity across Teams & Projects
·
Project Health
·
Reports on Azure Pipelines at organization levels
DevOpSmartBoard is published in Marketplace.
https://marketplace.visualstudio.com/items?itemName=canarysautomationspvtltd.devopsmartboard
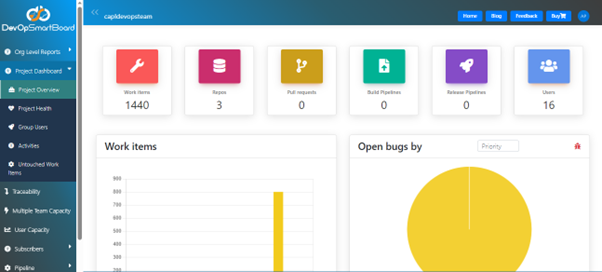
In this blog we will discuss about Project Dashboard, unlike Organization Dashboard this report provides metrics about the individual projects. The following information will be displayed in the report page:
The aim of the Project Dashboard is to show most required key metrics of the Project at one place. The dashboard view only the required key metrics and saves your time.
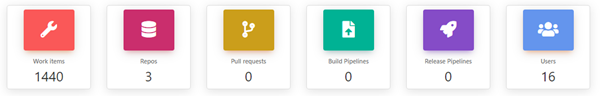
In the first section of the report, once the project is selected from the drop-down, the Tiles will display total count of work items, Azure Repos, count of Pull-Requests, Build & Release Pipeline count and total number of users in the project.
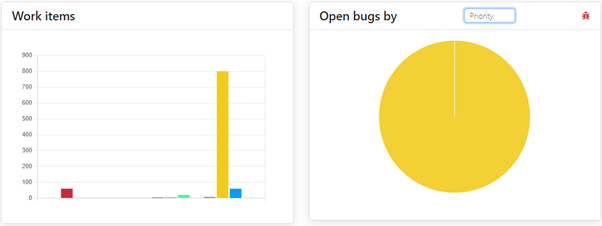
The next 2 sections are about “Work Items” and “Bug” Reports. The first one displays the work Items across selected projects based on the work item type. The report displays the trend for last 30 days, it provides the number of work item resent across projects based on the work item type.
In the third section, we see the trend charts for Build and Release executions. The charts present the 7-day trend on the outcome of the Build and Release whether the pipelines failed, passed, cancelled etc. This trend chart provides data point to understand the quality of Continuous Integration and Continuous Deployment. By seeing the trend or pattern, the decision makers can seek the cause behind the failures (if builds/releases are failing) and corrective actions.
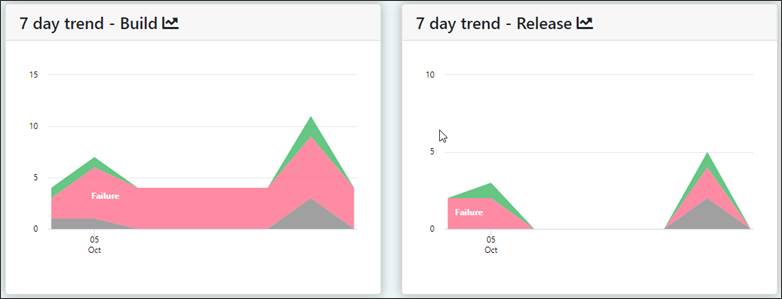
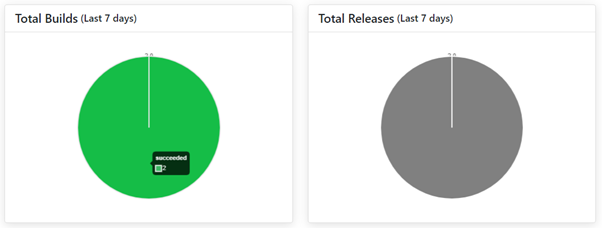
In the last section, we again have the Build and Release charts. If the above charts show the trend of pipeline execution outcome, these 2 radar charts show total count of the outcome of execution of the pipelines for last 7 days. This portrays the total failures/success of build and release pipelines.
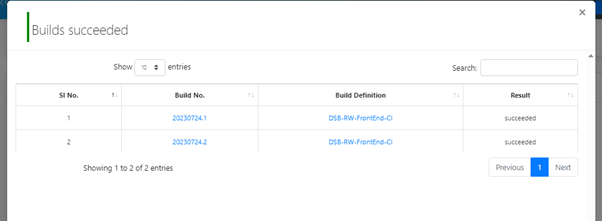
Clicking on the chart provides users with a detailed view of the builds or releases. For builds, the information displayed includes the build number, build definition, and the result, whether it succeeded or failed. This feature allows users to quickly access specific build-related details whenever needed.
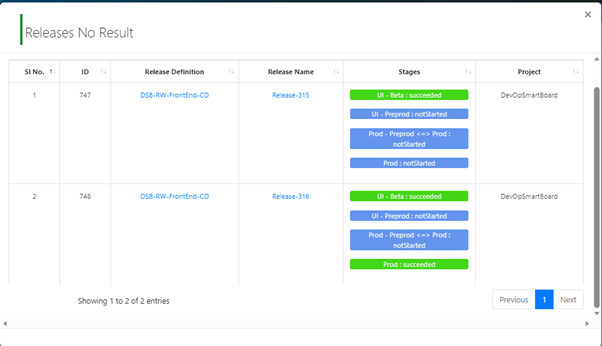
Similarly, for releases, clicking on the chart reveals comprehensive release information, such as the release definition, release name, stages, project, and the release ID. This level of detail offers valuable insights into the specific release processes and helps users understand the entire release pipeline.
Other reports and charts are explained in another blog, you can search other DevOpSmartBoard related blogs by searching the tag DevOpSmartBoard. For more details contact us at devopstools@ecanarys.com