DevOpSmartBoard
-
Organization
Dashboard
In this blog, we will be focusing on the Organization Dashboard, which provides valuable metrics about the Azure DevOps Organization.
The primary objective of this dashboard is to present essential key metrics of the organization, streamlining the process and saving valuable time. Users can conveniently select multiple projects to view only the necessary key metrics, enhancing efficiency and data standardization.
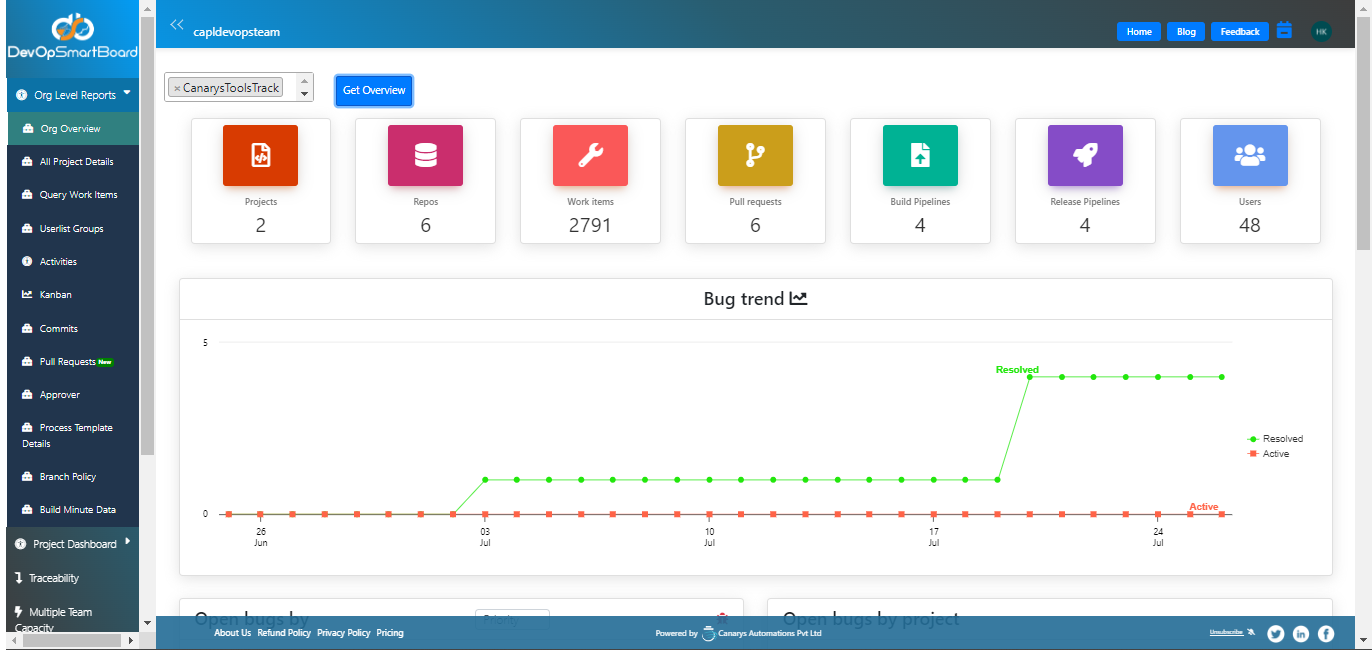
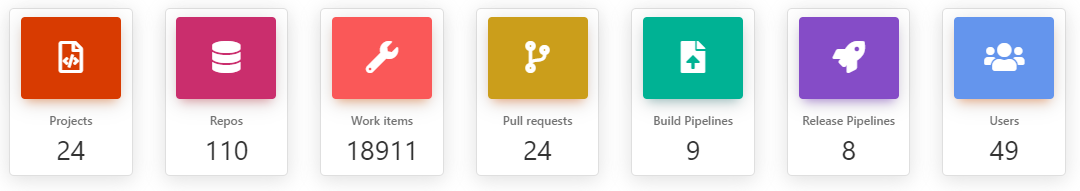
In the first section of the report, the tiles will display the total count of Work Items, Azure Repos, Pull-Requests, Build & Release Pipeline for the projects you selected and total number of Users in the organization.
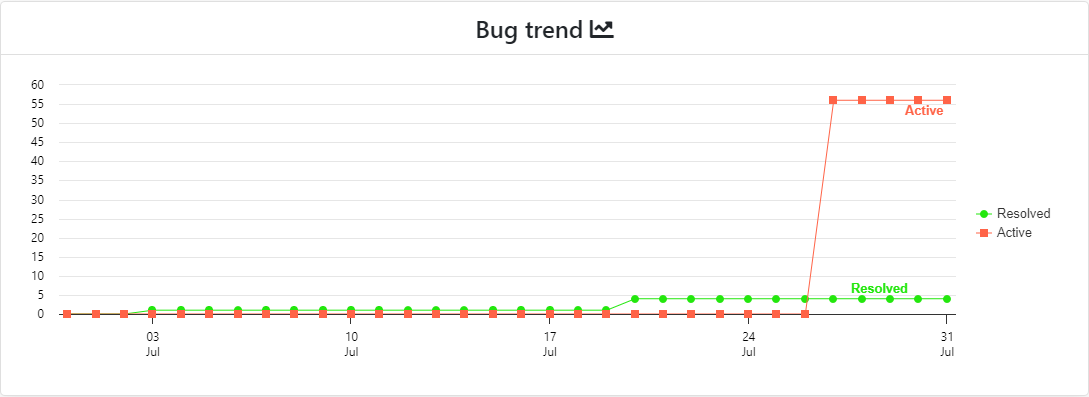
The next two sections are about “Bug” Reports. The first one displays the Bug Trend across selected projects based on "Active" & "Resolved" states. The report displays the trend for last 30 days,
it provides following insights
1. Identifying an increase in bugs across projects.
2. Monitoring the frequency of bug resolutions, indicating whether bugs are regularly worked on and resolved.
3. Analyzing if there is an exponential growth in the number of active bugs. 4. Evaluating the rate at which bugs are resolved, determining if they are being addressed rapidly.
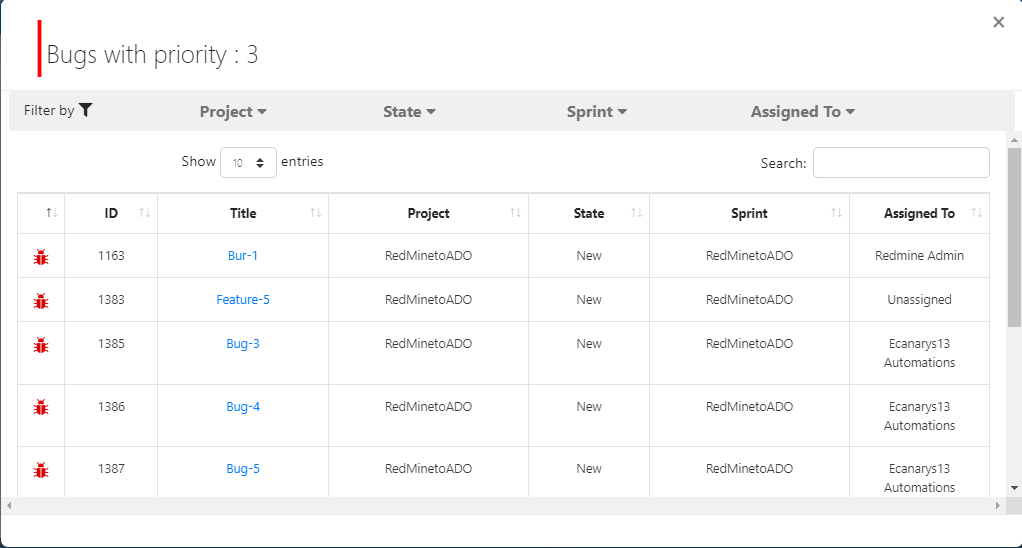
In the second section of bug reports, they are two charts "Open Bugs by Priority/Severity" and "Open Bugs by Project". The first provides metrics on how many bugs are there and categorized by severity, the second chart depicts open bugs by project wise and provides break-up by severity.
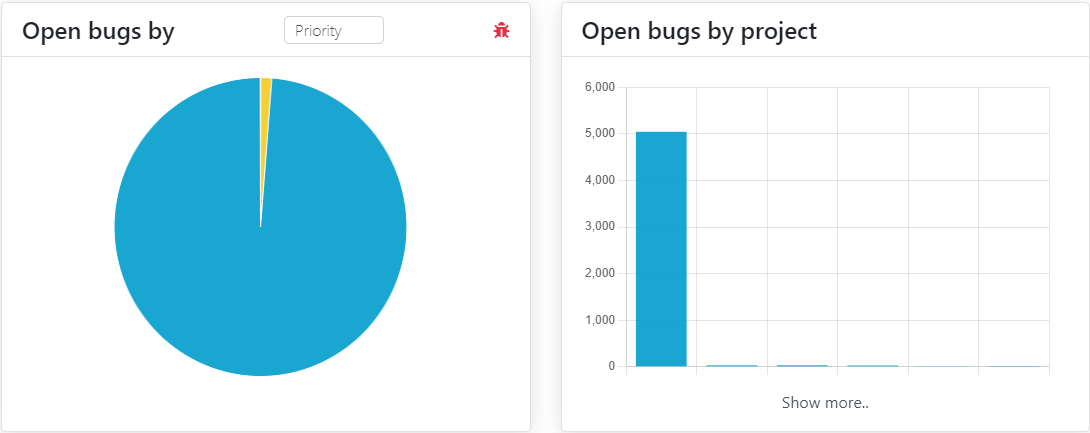
Also, you can see more details of the Bug report in tabular format by clicking on the charts.
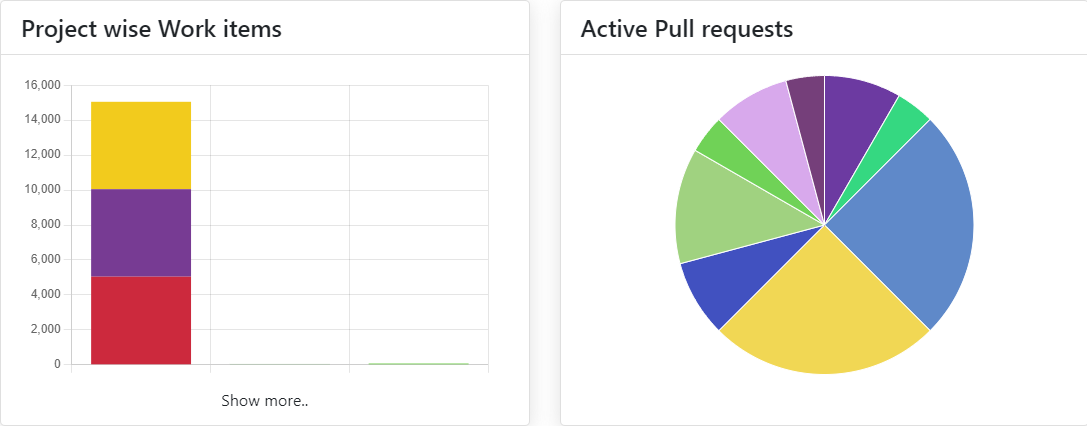
Next section has stacked bar graph which provides the count of work items with its work item type by projects. You can click on “Show more” button for better view. The pie chart depicts “Active Pull Requests” for selected projects.
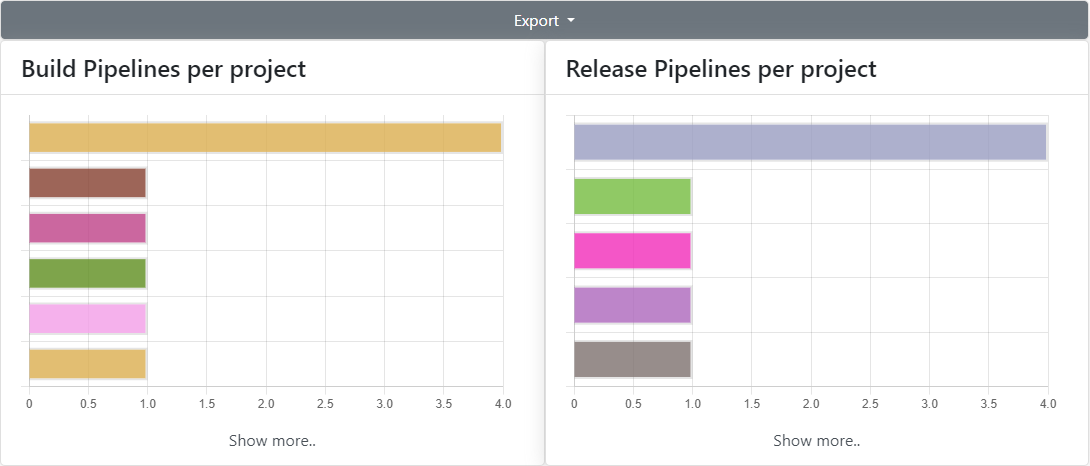
In the final section, we present two horizontal bar charts focused on pipelines. The first chart shows the count of Build Pipelines per project, while the second one shows the count of Release Pipelines per project. These graphs offer valuable insights into which projects are utilizing the pipeline feature of Azure DevOps more extensively.
To view the pipeline count for all projects, users can click on "Show more," which will display an expanded popup modal containing pipeline information.
This report provides the convenient feature of exporting the "Build and Release" details separately or combined into Excel sheets.
Other reports and charts are explained in another blog, you can search other DevOpSmartBoard related blogs by searching the tag DevOpSmartBoard. For more details contact us at devopstools@ecanarys.com